Data-Clinic Lab
IN THIS LESSON
Welcome to the evaluation phase. You’ve trained and tested your donut sorter. Now it’s time to measure how well it actually performed. We’ll use a special tool called a Confusion Matrix to see what your model got right and where it got confused.

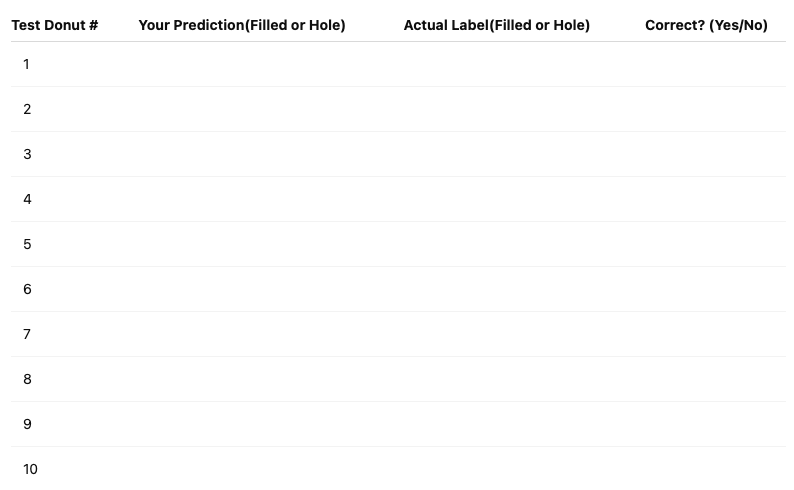
Record Your Test Results
Take your 10 test donuts and fill in the table below. For each donut, write down what your rules predicted and what the donut’s actual label was.
Part 3 – Calculate Your Accuracy
Accuracy tells you the percentage of predictions your model got right overall. Use the numbers from your Confusion Matrix to calculate your accuracy.

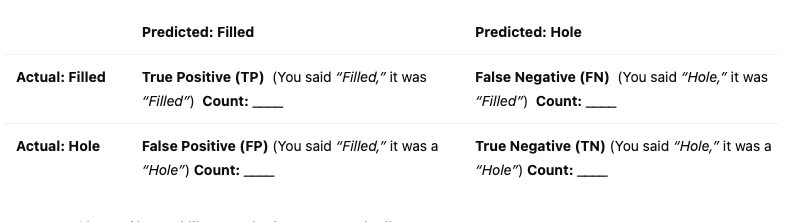
Part 2 – Build Your Confusion Matrix
Using the counts from Part 1, tally each outcome below and write the total in the correct box.
Key Terminology
Confusion Matrix: A table that summarises the performance of a classification model by showing counts of correct and incorrect predictions.
True Positive (TP): A correct positive prediction (correctly identified a Filled donut).
True Negative (TN): A correct negative prediction (correctly identified a donut with a Hole).
False Positive (FP): An incorrect positive prediction (Type I error) – thought a donut with a Hole was Filled.
False Negative (FN): An incorrect negative prediction (Type II error) – thought a Filled donut was a donut with a Hole.
Accuracy: The percentage of total predictions that were correct; a general measure of model performance.
Reflection
Analyse your model's performance. Where did it make mistakes (False Positives/Negatives)? Looking back at your dataset, what potential sources of bias might have caused these errors? (e.g., Were there more of one type of donut in your training set? Were some images confusing?)